Support and Resistance is a powerful pillar to trading and most strategies have some type of support/resistance (S/R) analysis built into them. Support and Resistance provides the trader many clues about the market and how to trade with it. This is the first part in a multi-part series on support and resistance. Today, we are going to look at what Support and Resistance is and what its benefits are to traders.
Support and Resistance is one of the most widely followed technical analysis techniques in the financial markets. It is a simple method to analyze a chart quickly to determine 3 points of interest to a trader:
- Which direction to trade the market
- Timing an entry in the market
- Establishing points to exit the market at either a profit of loss
If a trader can answer the 3 items above, then they essentially have a trading idea. Identifying levels of Support and Resistance on a chart can answer those questions for the trader.
What is Support and Resistance?
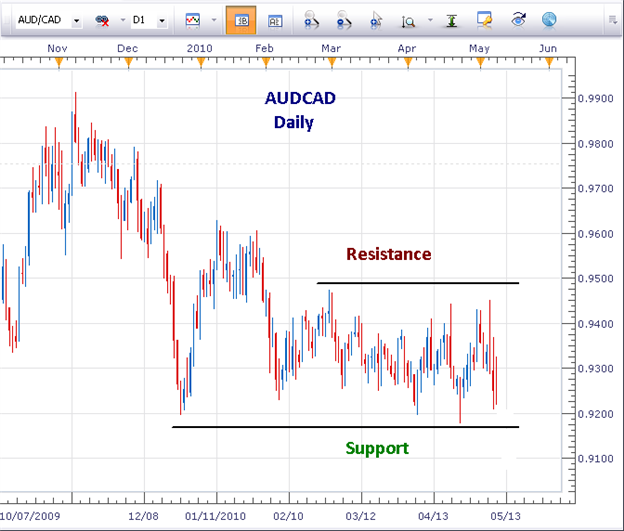
(Created using FXCM’s Marketscope 2.0 charts)
As you can see on the chart above, Support is a price level below which a currency pair has difficulty going and Resistance is a price level above which a pair has difficulty going. Think of the area between support and resistance as being a room. Support is the floor and resistance is the ceiling. The pair will move between those two levels until a “breakout” occurs in one direction or the other.
In theory, support is the price level at which demand (buying power) is strong enough to prevent the price from declining further. The rationale is that, as the price gets closer and closer to support, and becomes cheaper in the process, buyers see a better deal, and are more likely to buy. Sellers become less likely to sell, since they are getting a worse deal. In that scenario, demand (buyers) will overcome supply (sellers) and that will prohibit price from falling below support.
As one might suspect, support does not always hold. When price breaks below support, that behavior indicates that the sellers have won out over the buyers. This breach of support indicates that now the trading mindset is more inclined to sell than buy. After a support level is broken, a trader can expect another level of support to be established at the next point where buyers have established themselves.
Resistance, on the other hand, is the price level at which supply (selling power) is strong enough to prevent the price from rising further. The rationale behind this is that as the price gets closer and closer to resistance, and becomes more expensive in the process, sellers are more likely to sell and buyers become less likely to buy. In that scenario, supply (sellers) will overcome demand (buyers) and that will prohibit price from going above resistance.
Like support, resistance does not always hold and a break above resistance demonstrates that the bulls (buyers) have won out over the bears (sellers). Since resistance has been broken, buyers now have an increased willingness to buy at even higher prices since price has continued to move up, and doesn’t look likely to come back down. Once the former resistance level is broken, a new level of resistance will be formed at a level where sellers have taken a stand.
As a general rule, the longer the time frame of the chart, the stronger the established support and resistance levels will be. In other words, support and resistance levels reflected on a Daily chart will be stronger than those appearing on a 1-hour chart, for example.
With this basic introduction, it’s probably pretty easy to see how beneficial an understanding of support and resistance can be in your trading. Traders who accurately recognize strong support and resistance levels often do much better at locating trading opportunities and often have more confidence in how to manage their trades (where to place their stop loss and take profit levels).