Tuesday, July 26, 2011

EU create ending diagonal wave 5

salam
hi guys.. update eu base on ew.. still in progress in subwave 5 to completed wave C...

Sunday, July 24, 2011

EU h1 outlook

hi all...

update count eu base on direct chart count..my personal view eu to complete wave 2 in subwave c.. subwave c can be 61.8 or 78.6..(1.45xx).i'm still bias eu sell rally if eu not break 1.45xx...count valid if eu not break previous high.next extension eu subwave i progress 1.40xx fo this week view...TAYOR.

Wednesday, July 20, 2011

US Dollar Support Break Suspect Absent Confirmation From S&P 500

The US Dollar has cleared important support but lack of confirmation from the S&P 500 casts doubt on the move’s bearish implications for the safe-haven currency. 


THE TAKEAWAY – The US Dollar has cleared important support but lack of confirmation from the S&P 500 casts doubt on the move’s bearish implications for the safe-haven currency.
S&P 500 – The longer-term formation of the Head and Shoulders top we initially noticed two weeks ago and have beenmonitoring since continues play out, with prices consolidating between the 50% and 23.6% Fibonacci extension levels at 1299.41 and 1330.61, respectively. Overall positioning remains bearish whilst below 1358.50. A break below current support exposes 1285.46. Alternatively, a near-term push higher targets 1341.24.
US_Dollar_Support_Break_Suspect_Absent_Confirmation_From_SP_500_body_Picture_5.png, US Dollar Support Break Suspect Absent Confirmation From S&P 500
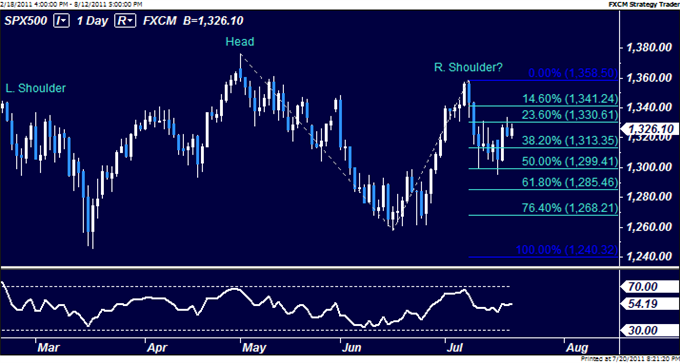
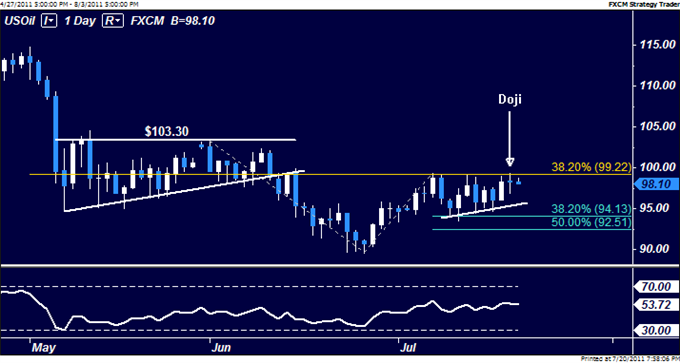
CRUDE OIL – Prices put in a Doji candlestick below resistance at $99.22, the 38.2% Fibonacci retracement of the drop from the early May swing high, pointing to indecision and hinting a move lower is ahead. The setup reinforces the likelihood of a forming Ascending Triangle chart pattern, mirroring the one carved out from early May through mid-June and arguing for bearish continuation. A break through triangle support at $95.50 initially exposes $94.13 and $92.51.
US_Dollar_Support_Break_Suspect_Absent_Confirmation_From_SP_500_body_Picture_6.png, US Dollar Support Break Suspect Absent Confirmation From S&P 500
GOLD – Prices rebounded from support lines at $1578.82, the 23.6% Fibonacci retracement level, having taken out rising channel support that upheld the rally since the beginning of the month. The move appears corrective, with a push above the July 19 high at $1609.95 needed to neutralize near-term selling pressure. A resumption of bearish momentum that clears current support initially exposes $1559.56. Longer-term positioning remains broadly bullish.
US_Dollar_Support_Break_Suspect_Absent_Confirmation_From_SP_500_body_Picture_7.png, US Dollar Support Break Suspect Absent Confirmation From S&P 500
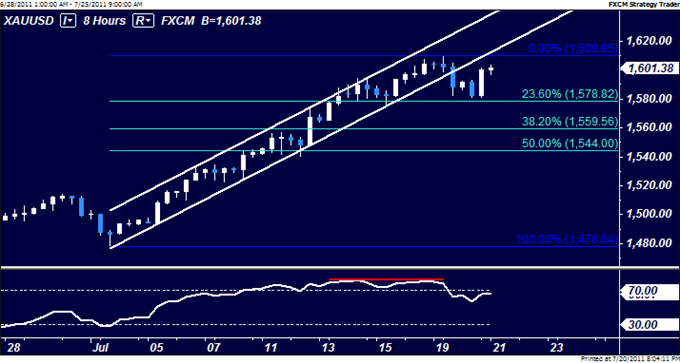
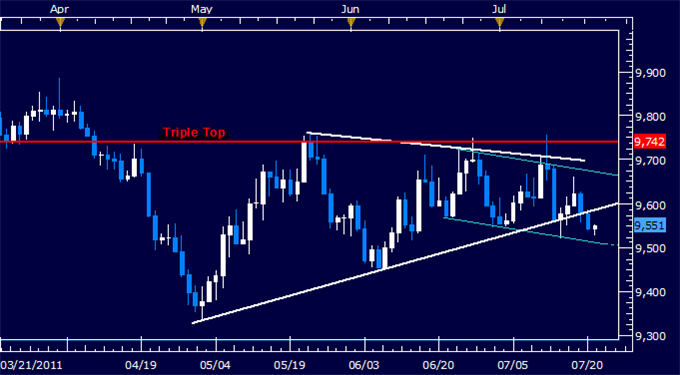
US DOLLAR – Prices broke through support marked by the lower boundary of a Triangle consolidation chart pattern, exposing the bottom of a falling channel that has guided prices since late June (now at 9513). The underside of the Triangle has been recast as near-term resistance, and now stands at 9586.
US_Dollar_Support_Break_Suspect_Absent_Confirmation_From_SP_500_body_Picture_8.png, US Dollar Support Break Suspect Absent Confirmation From S&P 500

Tuesday, July 19, 2011

Eye On EUR/GBP,BOE(Bank Of England)

The Bank of England will release the minutes from its most recent monetary policy meeting later today. The central bank left interest rates unchanged at 50 basis points earlier this month.

According to Kathy Lien, Director of Currency Research at GFT: “EUR/GBP will be our currency pair in play for the next 24 hours. We are expecting German producer prices at 2:00AM ET/ 6:00 GMT, followed by EZ consumer confidence at 10:00AM ET/ 14:00 GMT. The MPC meeting minutes published at 4:30AM ET/ 8:30 GMT should dictate much of the sentiment in the British pound.”

At present, EUR/GBP is ranging in Asia between 0.8790/0.8760, last quoted near its opening price in the 0.8775 zone.

To the downside, “if the pair declined amid a more hawkish mood from the Bank of England,” says Ms. Lien, the 50% Fibonacci level of the rally between 0.8328/0.9081 would provide support at 0.8683. Below there, she suspects the pair could encounter buying interest at a swing low in May, at 0.8610. To the upside, resistance lies at 0.8800 (psychological), “a level where the 100-day SMA and first Bollinger Band converge,” explains Ms. Lien. Above there, next major resistance lies at its 20-day SMA, 0.8904.

Monday, July 18, 2011

EU H1 count.

Salam hi guys...

long time no update my blog...huhuhu okey let see my chart my personal view EU tf h1 now need to completed subwave a...in area 61.8 or 78.6..count still valid if trend line support not break..good luck frenz..

Saturday, July 9, 2011

Getting Technical

If you know your way around a price chart then you are ready to learn a little more about technical analysis. This kind of analysis is defined as an attempt to try to forecast price movements based on patterns observed in price changes on charts, or other changes that are not rooted in fundamental observations.

For technical analysts the key to observing the market lies in signals and patterns

Technical analysts (or technicians as they are sometimes called) are looking for all kinds of things in the rates of price changes, the patterns that price changes might be making, shifts in volume and open interest, and more! They are trying to find anything that could be used to show a potential trading opportunity - something that could help them forecast possible future movements. It is important to add a disclaimer here – Past performance is not necessarily indicative of future results. There is no way that finding a pattern or indicator in a chart will be a guarantee of what will happen in the market. They are all subject to the same personal bias and are just as fallible as any other forecasting method.

Why would anyone use technical indicators? 

Technical analysis is a means of trying to decipher the market trend or a possible reversal of that trend. Like any other kind of analysis, it is meant to be used in tandem with other observations, ideas, and fundamentals to give a bigger picture when planning possible trades. Even the most basic patterns in technical analysis can be used for trade entry and exit points. Here are some examples:

An uptrend may be present when there are a run of trading periods with higher high prices and higher low prices. Identify an uptrend, and you might get an idea for a long trade. A downtrend could be characterized by a period with lower highs and lower lows. At that time, you might want to find a place to play a short trade. If the market is seeing pretty equal highs and lows, it could be stuck in a sideways trend or channel. Even those have trading opportunities since the high spots could be identified as overhead resistance, where prices will go and then stop and retreat as selling enters the market. The low prices could be showing you key areas of support when the prices get to a point where buying occurs and the market doesn't seem to go any lower. 


Past performance is not necessarily indicative of future results. Chart courtesy of Gecko Software.

Support and resistance offer interesting entry or exit opportunities. It would be a much more improbable trade if you decided to go long (buy a contract) right as the market was hitting an area of potential resistance. Likewise, it might be riskier to enter a sell order just as the market is getting to an area previously known as support. This isn't to say that your trade wouldn't work, it is just good to know these spots and understand what is behind them – it'll make designing your trade a little more effective. Perhaps you would want to play these areas in case support or resistance is forecast to be broken based on your fundamental analysis or a piece of news due out in the market; or, perhaps other technical signals are telling you that the trend is about to be broken. Here are some other basic signals technicians might look for:

Head and shoulders patterns are formed when the market prices make a peak (first shoulder) and then decline, subsequently rise above the former peak (the head) and decline again, and finally make another peak (shoulder) not higher than the head and decline once more. This pattern is seen as a possible trend reversal. It is a bearish pattern in an uptrend.

Inverse or reverse head and shoulders are also possible, marked by spikes downwards and then recovery resulting in the reverse should-head-shoulder pattern described above. This is seen as a bullish pattern if it occurs in a downtrend. 

Triangles, pennants and flags are also key patterns technicians keep an eye on. They can be bullish or bearish depending on the prevailing trend and the way they are formed. Flags and pennants are seen as signals of a continuation where the market sees a kind of consolidation of action before making a move in another leg of the trend. Volume also comes into play with flags and pennants, usually lower or weakening volume.


Find patterns, find a trade 
If you can back up your trading bias with actual technical observations or patterns that might indicate the market is trending or about to see a reversal, then you have a trading opportunity! Rather than boldly (and blindly) placing buy or sell orders and hoping the market moves in your favor, taking the time to learn and understand how the market behaves can make or break your trade design. Other people are looking at the same information and furthering your education can never really be a bad thing!