The Fibonacci Studies and FinanceWhen used in technical analysis, the golden ratio is typically translated into three percentages: – 38.2%, 50% and 61.8%. However, more multiples can be used when needed, such as 23.6%, 161.8%, 423% and so on. There are four primary methods for applying the Fibonacci sequence to finance:
retracements, arcs, fans and time zones.
1. Fibonacci RetracementsFibonacci retracements use horizontal lines to indicate areas of
support or
resistance. They are calculated by first locating the high and low of the chart. Then five lines are drawn: the first at 100% (the high on the chart), the second at 61.8%, the third at 50%, the fourth at 38.2%, and the last one at 0% (the low on the chart). After a significant price movement up or down, the new support and resistance levels are often at or near these lines. Take a look at the chart below, which illustrates some retracements:
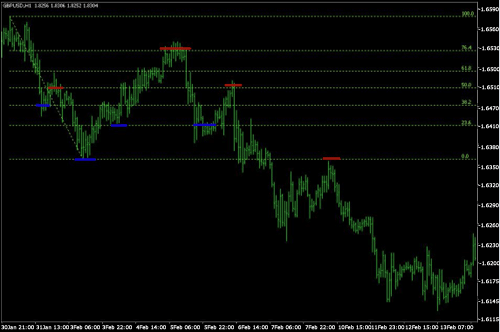 Created Using MetaTrader 2. Fibonacci Arcs
Finding the high and low of a chart is the first step to composing Fibonacci arcs. Then, with a compass-like movement, three curved lines are drawn at 38.2%, 50% and 61.8%, from the desired point. These lines anticipate the support and resistance levels, and areas of
ranging. Take a look at the chart below, which illustrates how these arcs do this:
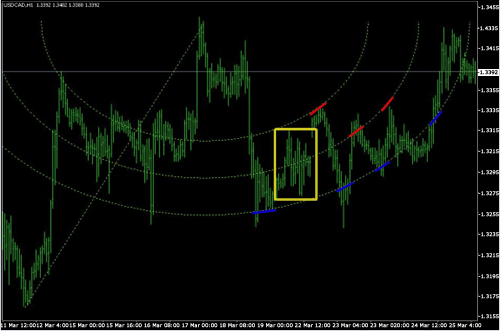 Created Using MetaTrader
3. Fibonacci FansFibonacci fans are composed of diagonal lines. After the high and low of the chart is located, an invisible vertical line is drawn though the rightmost point. This invisible line is then divided into 38.2%, 50% and 61.8%, and lines are drawn from the leftmost point through each of these points. These lines indicate areas of support and resistance. Take a look at the chart below:
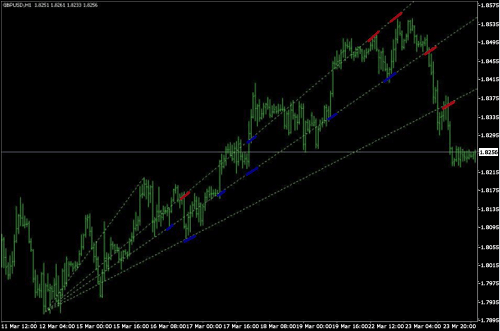 Created Using MetaTrader 4. Fibonacci Time Zones
Unlike the other Fibonacci methods, time zones are a series of vertical lines. They are composed by dividing a chart into segments with vertical lines spaced apart in increments that conform to the Fibonacci sequence (1, 1, 2, 3, 5, 8, 13, etc.). These lines indicate areas in which major price movement can be expected.
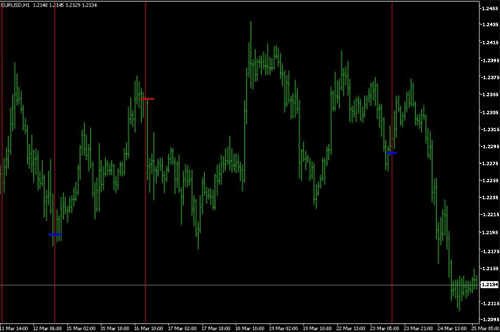 Created Using MetaTrader Conclusion
These Fibonacci studies are not intended to provide the primary indications for timing the entry and exit of a stock; however, they are useful for estimating areas of support and resistance. Many people use combinations of Fibonacci studies to obtain a more accurate forecast. For example, a trader may observe the intersecting points in a combination of the Fibonacci arcs and resistances. Many more use the Fibonacci studies in conjunction with other forms of technical analysis. For example, the Fibonacci studies are often used with
Elliott Waves to predict the extent of the retracements after different waves. Hopefully you can find your own niche use for the Fibonacci studies, and add it to your set of investment tools!


